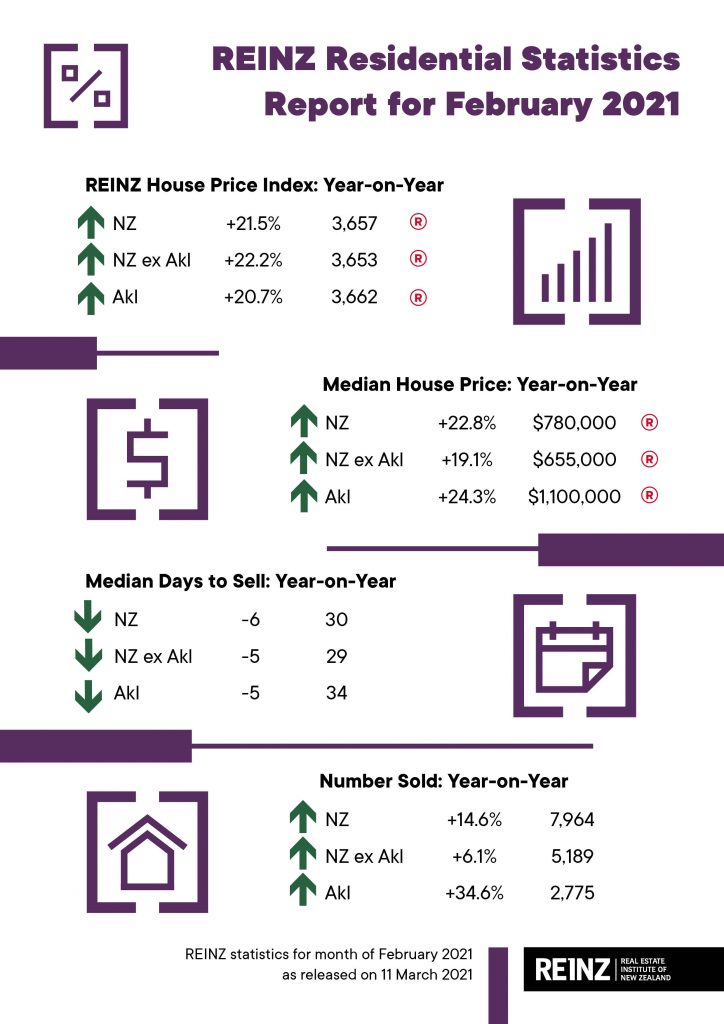
The unrelenting pace of property sales continued in February, with a 14.6% uplift on sales volumes compared to the same time last year according to the latest data from the Real Estate Institute of New Zealand (REINZ)
In February, 9 out of 16 regions saw annual increases in sales volumes. Regions with the biggest increases were:
- Auckland +34.6% (from 2,061 to 2,775) – the highest for the month of February in 14 years.
- West Coast: +58.0% (from 50 to 79 – 29 more houses) – the highest it’s been since March 2004 (203 months) and the highest for the month of February ever
- Taranaki: +31.4% (from 153 to 201 – 48 more houses) – the highest for the month of February in 4 years
- Northland: +22.5% (from 191 to 234 – 43 more houses) – the highest for the month of February in 4 years.
“It’s highly likely that some of this uplift can be attributed to both investors and owner-occupiers looking to purchase ahead of the LVR restrictions coming back into effect in March and the slight uplift in listings we’ve seen over the last couple of months,” REINZ Chief Executive Bindi Norwell says.
Century 21 New Zealand Owner agrees that the February surge was partly due to restrictions on loan-to-value ratios (LVRs) returning and some lift in listings nationwide, but says it’s by no means the last of the summer wine.
“First-home buyers are still keen to make the most of record-low interest rates and investors are keen to beat the 40% deposit requirement from 1 May and any other handbrakes the Government might introduce,” she says.
“As long as interest rates remain low, rents stay high, and other investment opportunities look less appealing, the allure of property will continue for owner-occupiers and landlords alike,” says Mayne.
Even with LVRs coming back into effect in March, REINZ expects to see sales volumes continue at a solid pace over the next couple of months; but Norwell says this will in part rely on a steady stream of new listings coming onto the market.
Mayne says March is already looking good, but it will really rely on more listings.
“We know that if we can get the listings, we can definitely turn them into great sales. The market is holding up really well with demand for housing still incredibly strong.”
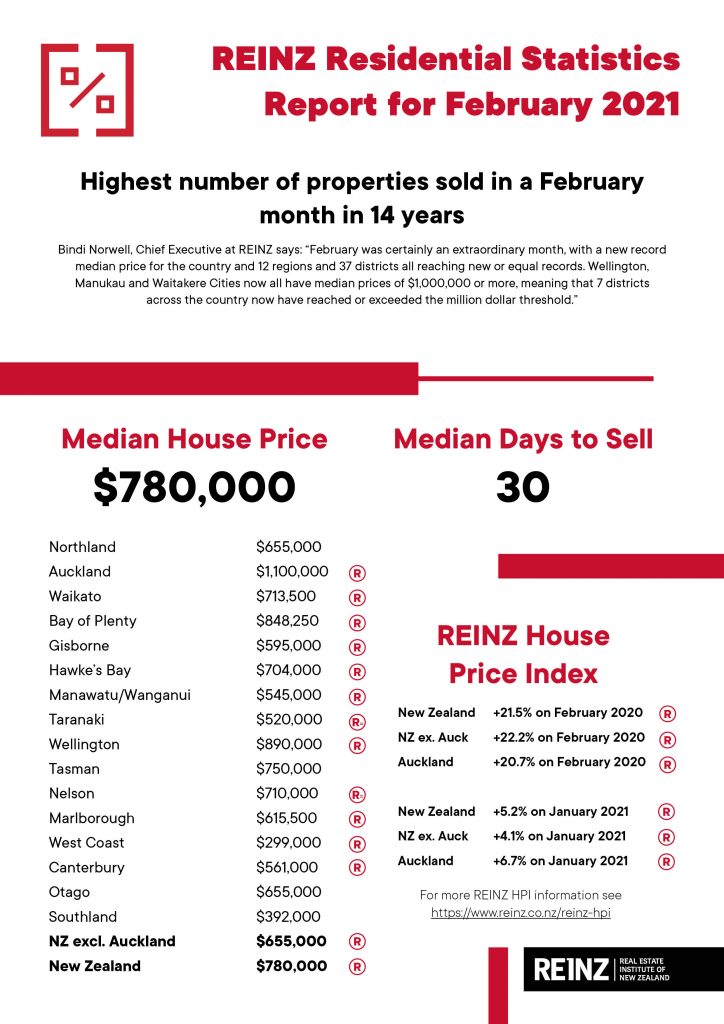
NZ & NZ ex Auckland reach record highs in Feb, as did 12 out of 16 Regions & 37 Districts
Median prices for residential property across New Zealand increased by 22.8% from $635,000 in February 2020 to $780,000 in February 2021 a new record high for the country. Additionally, 12 out of 16 regions reached record median prices and so did 37 Districts.
Median house prices for New Zealand excluding Auckland increased by 19.1% from $550,000 in February last year to $655,000.
Auckland’s median house price increased by 24.3% from $885,000 at the same time last year to $1,100,000 – a new record for Auckland. Additionally, Auckland City, Franklin District, Manukau City, North Shore City, Papakura District and Waitakere City all reached new record median highs.
In addition to Auckland, 9 other regions reached record median prices and two regions reached record equals. They were:
- Waikato: with a 23.0% increase from $580,000 in February 2020 to $713,500 in February 2021. Additionally, Hamilton City ($750,000), Taupo District ($690,000), Thames-Coromandel District ($865,000), Waikato District ($675,000) and Waipa District ($760,000) all reached record median highs in February
- Bay of Plenty: with a 26.8% increase from $669,000 in February 2020 to $848,250 in February 2021. Additionally, Rotorua District ($617,000), Tauranga City ($905,000) and Western Bay of Plenty District ($855,000) all reached record median highs in February
- Gisborne: with a 32.2% increase from $450,000 in February 2020 to $595,000 in February 2021
- Hawke’s Bay: with a 36.4% increase from $516,000 in February 2020 to $704,000 in February 2021 – the fourth record median price in a row. Additionally, Hastings District ($772,300) reached a record median high in February
- Manawatu/Wanganui: with a 27.0% increase from $429,000 in February 2020 to $545,000 in February 2021 – the eighth record median price in a row. Additionally, Horowhenua District ($549,000), Palmerston North City ($676,500), Ruapehu District ($410,000) and Rangitikei District ($405,000) all reached record median highs in February
- Taranaki: was a record equal remaining on the same median price as January 2021 at $520,000. Additionally, New Plymouth District ($600,000) and South Taranaki District ($397,000) and Stratford District ($460,000) all reached record median highs in February
- Wellington: with a 24.0% increase from $718,000 in February 2020 to $890,000 in February 2021. Additionally, Lower Hutt City ($839,000), Masterton District ($640,000), Porirua City ($980,000), Wellington City ($1,100,000) and South Wairarapa District ($782,000) all reached record median highs in February
- Nelson: was a record equal remaining on the same median price as January 2021 at $710,000
- Marlborough: with a 15.9% increase from $531,250 in February 2020 to $615,500 in February 2021
- West Coast: with a 32.9% increase from $225,000 in February 2020 to $299,000 in February 2021. Additionally, Grey District ($285,000) was a record median high in February
- Canterbury: with an 18.4% increase from $474,000 in February 2020 to $561,000 in February 2021. Additionally, Christchurch City ($581,000), Selwyn District ($660,000) and Waimakariri District ($540,000) all reached record median highs in February.
“Wellington, Manukau and Waitakere Cities now all have median prices of $1,000,000 or more, meaning that 7 districts across the country now have reached or exceeded the million dollar threshold,” says Norwell.
“It’s likely that February’s housing data will make very difficult reading for the thousands of renters and first home buyers who are one day hoping to be able to purchase a property. Hopefully the re-introduction of the LVRs will start to slow down the rate at which prices have been rising, and that the market will stabilise in due course.
“Now more than ever, we need our political parties to work together and to work closely with key industry players in order to start addressing the unaffordability issues and to address the housing shortages the country faces,” continues Norwell.
“For a number of months now, REINZ has been calling on the Government to review the First Home Loan Scheme as the percentage of properties eligible for this Scheme continues to fall. In Auckland alone, less than 20% of properties sold would be eligible for support, showing just how out of reach the programme is with where house prices have now moved to,” concludes Norwell.
REINZ HPI hits new high again in February
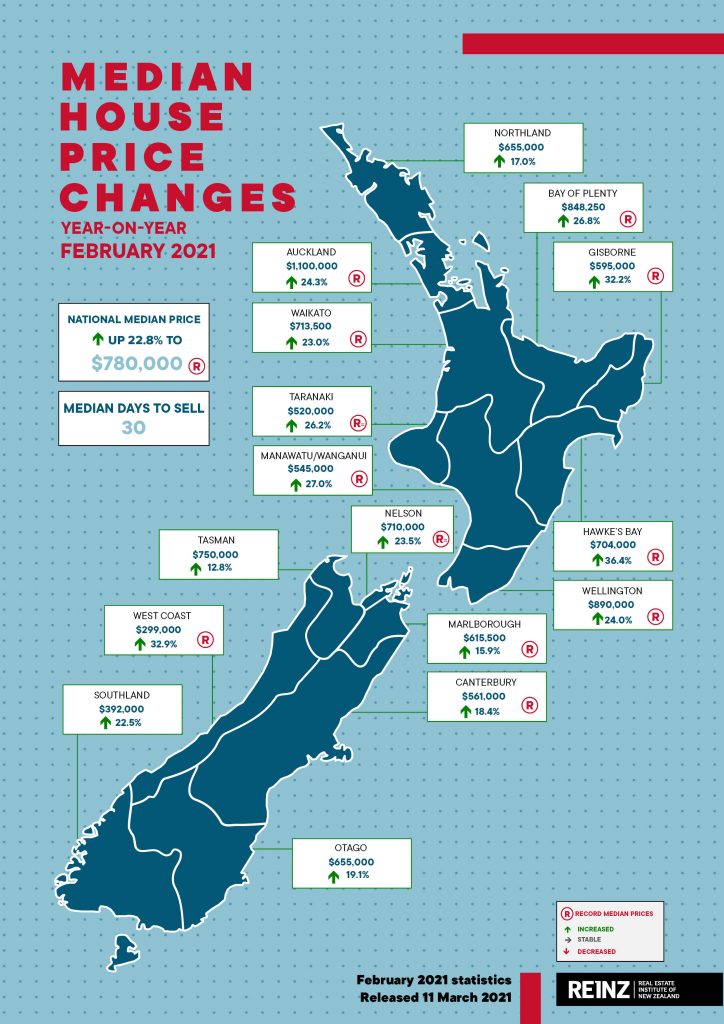
The REINZ House Price Index (HPI) for New Zealand, which measures the changing value of property in the market, increased 21.5% year-on-year to 3,657 a new high on the index. This is the first time the index has exceeded the 3,500 mark and was the highest annual percentage increase in the HPI that we’ve seen in 201 months (May 2004) showing just how strong the market was in February.
The HPI for New Zealand excluding Auckland showed house price values increased 22.2% from February 2020 to 3,653 in February 2021 a new high on the index and the highest percentage increase in 199 months (July 2004).
Auckland’s house price values increased 20.7% year-on-year to 3,662 meaning house values in the City of Sails have increased by more than 260% since 2003 when the index base level was set.
Additionally, every region reached a new high on the index.
In February, Gisborne/Hawke’s Bay again had the highest annual growth rate in house price values with a 30.1% increase to a new record index level of 4,110. In second place was Manawatu/Wanganui with a 29.4% increase and in third place was Wellington with a 29.2% annual increase in house price values. Both Manawatu/Wanganui and Wellington’s increases were the largest HPI movement for the respective regions on record.
Median days to sell lowest for a February month in 17 years
In February, the median number of days to sell a property nationally decreased 6 days from 36 to 30 when compared to February 2020, the lowest for a February month in 17 years.
For New Zealand excluding Auckland, the median days to sell decreased by 5 days from 34 to 29, the lowest for a February month in 17 years.
Auckland saw the median number of days to sell a property decrease by 5 days from 39 to 34, the lowest for the month of February in 6 years.
More than half the country (10 regions) had a median number of days to sell of less than 30 – the first time in we’ve seen this in a February month since records began.
Properties in Taranaki have sold at their fastest rate of any region with the median number of days to sell at 21 compared to 25 in February 2020.
Northland had the highest days to sell of any region at 47 days, albeit down from 60 days at the same time last year and the lowest February month for 14 years.
Nearly a third of NZ homes sold by auction in February – highest level of auctions ever
February saw nearly a third of all properties sold by auction (29.2%), with 2,322 properties selling under the hammer – up from 16.4% at the same time last year, when 1,139 properties were sold via auction. This was the highest percentage of auctions we’ve ever seen in New Zealand.
New Zealand excluding Auckland saw 19.6% of properties sold by auction, up from 10.1% in February 2020.
Gisborne had the highest percentage of auctions across the country with 70.3% (45 properties) sold under the hammer, down from 75.6% (59 properties) in February 2020.
Bay of Plenty again had the second highest percentage of auctions in New Zealand with 47.8% of properties (229 properties) sold under the hammer in February up from 18.9% at the same time last year (97 properties) – this was the highest percentage of auctions ever for the Bay of Plenty.
In third place was Auckland with 47.0% (1,303 properties) sold under the hammer up from 31.3% in February 2020 (645 properties). This was the highest percentage of auctions in a February month since records on sales methods began.
Also of note was Northland with 19.7% (46 properties) sold under the hammer, up from 6.3% (12 properties) at the same time last year. This is the first time ever that the percentage of auctions in Northland reached double digits.
Inventory levels continue to fall, placing pressure on housing market
The total number of properties available for sale in New Zealand decreased by 24.2% in February to 15,829 down from 20,875 in February 2020 – 5,046 fewer properties compared to 12 months ago and 11,021 fewer properties than in February 2019.
Only Gisborne saw an annual increase in inventory levels, with a 19.8% increase on the same time last year (from 86 to 103 properties).
Regions with the largest percentage decrease in total inventory levels were:
- West Coast: -46.4% from 319 to 171 – 148 fewer properties
- Nelson: -43.5% from 359 to 203 – 156 fewer properties
- Manawatu/Wanganui: -40.3% from 687 to 410 – 277 fewer properties
- Bay of Plenty: -39.5% from 1,254 to 759 – 495 fewer properties
- Northland: -39.0% from 1,230 to 750 – 480 fewer properties
- Waikato: -38.4% from 1,518 to 935 – 583 fewer properties.
Manawatu/Wanganui had the lowest level of inventory in the country at 6 weeks, followed by Wellington in with 7 weeks’ inventory.
In third equal place were Waikato, Bay of Plenty and Nelson – all with 8 weeks’ inventory.
West Coast and Northland had the highest number of weeks’ inventory with 29 and 19 weeks’ inventory available respectively to prospective purchasers down from 51 and 53 weeks respectively at the same time last year.
Price Bands
The number of homes sold for less than $500,000 across New Zealand fell from 30.5% of the market (2,117 properties) in February 2020 to 17.6% of the market (1,399 properties) in February 2021 – this is the lowest percentage of properties in the sub-$500,000 bracket ever.
The number of properties sold in the $500,000 to $750,000 bracket fell from 33.0% (2,295 properties) to 28.7% (2,282 properties).
At the top end of the market, the percentage of properties sold for $1 million or more increased from 17.1% (1,187 properties) in February 2020 to 30.7% (2,446 properties) in February 2021 – the first time this figure has gone over the 30% mark.

