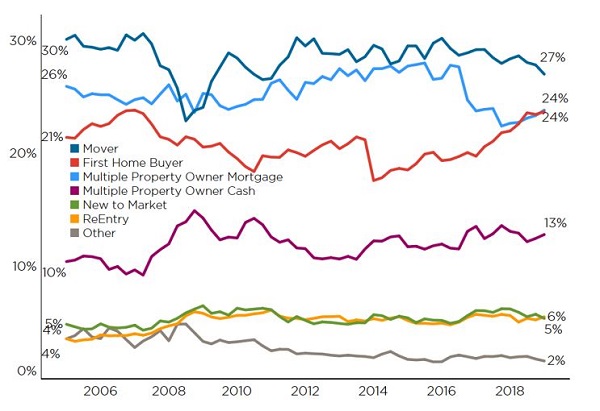
In the first quarter of 2019, first home buyers (FHBs) and mortgaged multiple property owners (investors) each accounted for 24% of property purchases, CoreLogic research finds

For a long period of time, investors had a much larger market share, but LVR III (40% deposit) dampened their activity from October 2016 and meanwhile FHBs have slowly and surely kept raising their presence. This is not to say that there is always direct competition between the two groups, or that an investor buying is always locking out a FHB (or vice versa). But it’s still interesting that their market shares are similar and these may well continue to be the two groups to watch for the rest of 2019.

NZ % share of purchases
The Q1 data for Buyer Classification is now complete and it confirms that ‘movers’ (existing owner occupiers) are less active than in the past, with first home buyers (FHBs) and mortgaged multiple property owners (MPOs) the key groups of interest at present.
Over the first three months of the year, ‘movers’ accounted for 27% of property purchases, which is down a touch from 28% a year ago and from 29% in Q1 2017. With the next step up the property-buying ladder still hard to achieve – e.g. due to the transactions costs (legal, estate agent), as well as any extra equity/debt required – it’s not really surprising that more movers are happy to stay put, and perhaps renovate instead.
Meanwhile, as the first chart shows, the gap between FHBs and mortgaged multiple property owners (MPOs, or investors) remains tight, with both sitting on 24% of purchases in Q1 (albeit at one decimal place MPOs are slightly ahead of FHBs, at 23.9% versus 23.7%). From the LVR III-induced trough for mortgaged MPOs of 22% in Q4 2017, they’ve slowly crept back into the market on the back of more finance becoming available again. And their comeback is despite several new rules from the government which have raised costs (e.g. extra insulation, changes to negative gearing).

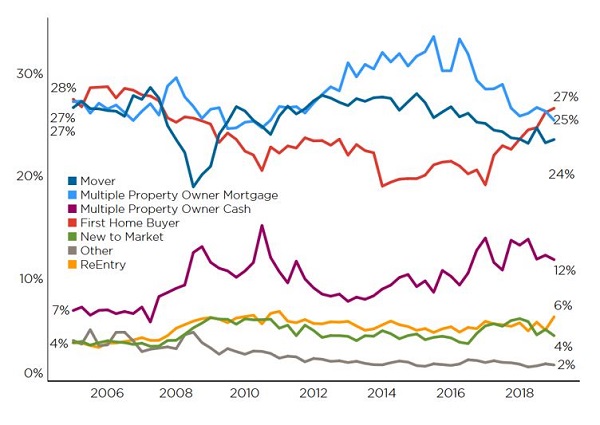
Auckland % share of purchases
For FHBs, although the strong upwards trend from 2014 to mid-2018 has flattened off in the past 3-6 months, their share of purchases is still high in an historical context. The ability to tap their KiwiSaver funds for a deposit, alongside a willingness to compromise on location/property type, are key factors keeping FHBs’ share of purchases high. CoreLogic figures show that as part of that compromise, FHBs are entering many markets around the country at prices 15-20% lower than the area’s average.
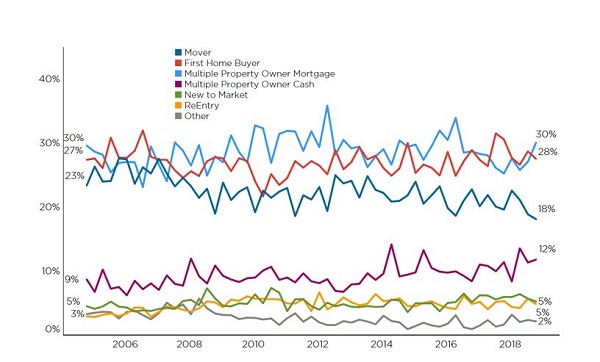
The national patterns largely apply in Auckland with movers relatively quiet and mortgaged investors ‘hanging in there’. What is an interesting aspect of the Auckland market at present is that despite average values being >$1m, FHBs are not just a strong presence, but they’re actually the largest individual buyer group with a 27% share (see the second chart). It’s a similar story in Wellington too, albeit in the capital mortgaged investors have perked up lately and their share of purchases (30%) has risen back above FHBs (see the third chart).

Wellington % share of purchases
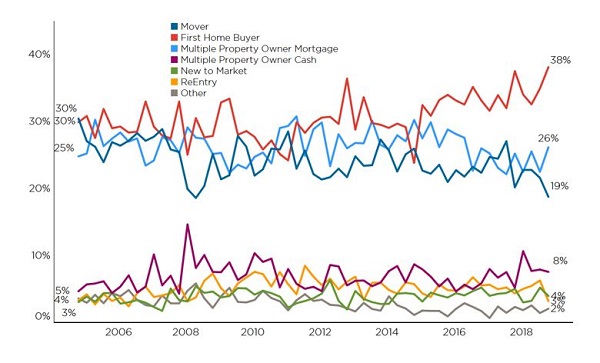
Although FHBs still have a decent presence in Wellington City, one clear option for those priced out is to purchase in the Hutt Valley and this is something that’s often heard about anecdotally. But our stats illustrate it emphatically – as the fourth chart shows, FHBs have a very strong market share in Lower Hutt (as well as in Upper Hutt and Porirua).

Lower Hutt % share of purchases
 Kelvin Davidson
Senior Research Analyst
CoreLogic


