According to the June 2020 QV House Price Index (HPI) results, the impact of the COVID-19 pandemic and ensuing economic shutdown on the property market is starting to show, says CoreLogic Head of Research Nick Goodall


Nationwide property values dropped -0.2% according to the latest monthly reading, and were down in four of the six main centres. Tauranga and Christchurch were the two main centres to so-far see values hold up, although the increases were a mere 0.2% each.
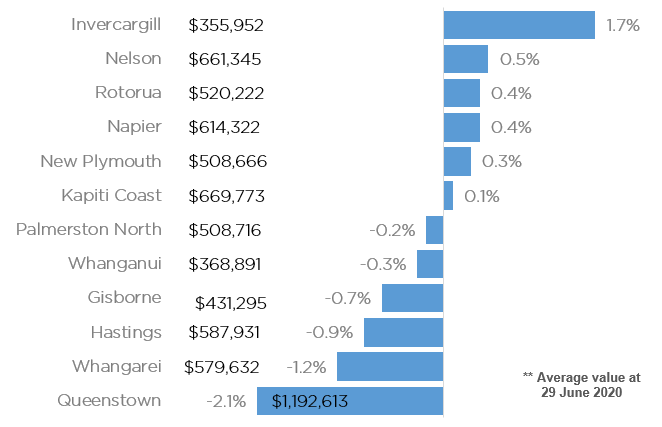
In the provincial centres there was a 50/50 split between value growth and value reduction over the June reading. Unsurprisingly, given its significant reliance on the heavily hit tourism industry, Queenstown saw the greatest drop in values in June of -2.1%.
Meanwhile Queenstown’s southern neighbour Invercargill, where the average property value is the lowest among the provinces ($356k), appears to be unaffected so far, with 1.7% growth according to the June measure. A relatively broad based economy, with little exposure to tourism, may protect Invercargill from any significant fall-away in property values, although its heavy reliance on the Tiwai Point Aluminium Smelter (6.5% of regional GDP, almost 1,000 employees) provides reason for caution on future vulnerability of the property market.
Back to the main centres and remaining down south, the June results showed Dunedin property values decreased by -0.9%, which is the greatest drop of the main centres and a turnaround in fortunes for the student city after consistently strong annual value growth which peaked at over 20% earlier this year. Demand from students was likely impacted by a stalling in foreign student arrivals and domestic students studying from home, both of which play a significant role in rental demand.
As well, reduced affordability, due to the strong property value growth as well as a recent increase in property investor activity (potentially vulnerable owners) are factors to consider for the future outlook, however the local economy, boosted by the building of the new hospital offers cause for optimism longer term.
Nelson, Napier and Rotorua all saw modest growth in property values over the June period. For Rotorua, a city well-known for tourism, the local economy may have been shielded slightly by a lift in domestic tourism. In fact, domestic tourism already made up a greater portion (60%) of tourism spend than international tourism did, so perhaps Rotorua’s vulnerability to the borders being closed has been over-stated. For context only 35% of tourism spend in Queenstown is domestic and only 45% in Auckland.
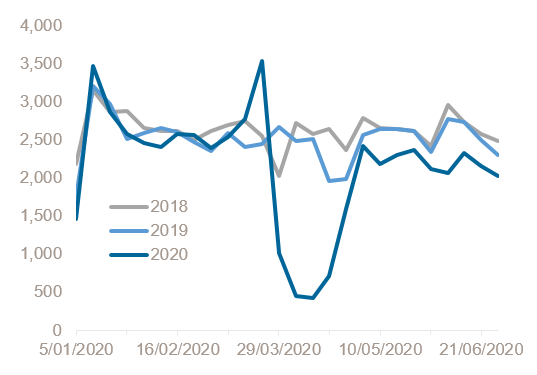
Looking at market activity, both listings and demand to buy, we appear to have returned to a level of seasonal normality. Agent appraisals, an excellent pre-listing indicator, have begun to taper off for winter after bouncing higher post-lockdown, and while for-sale listings saw a minor boost in June (likely displaced from previous months) expectations are for the usual winter lull to gradually kick in.
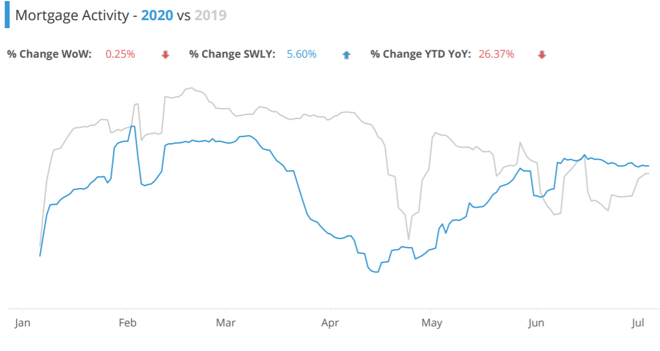
Demand for property, as defined by consumer activity in the banks (applications, approvals and valuations), remains high, suggesting the improved presence at open homes and auctions is more than just tyre kickers. Those people who have been mostly unaffected by recent events, are clearly continuing to act, albeit with reduced price expectations, as the house price index data shows.
Improving customer sentiment and low interest rates are also factors weighing towards the positive outlook. The possibility of a negative official cash rate only entrenches the ‘lower-for-longer’ mind-set for mortgage interest rates, though it must be noted any move into negative territory is unlikely until 2021 at the earliest, and even then only if economic conditions weaken. But mortgage interest rates around the 2% mark are a very real possibility within the next year.

New for-rent listings
Rental listings have also been a measure of great interest, with some expectation that there could be an increase, as rentals are vacated (due to tenants’ loss of income) and those listed on short-term accommodation sites switch to long term rentals (with the reduction in tourists). However rental listings remain below levels witnessed in previous years, suggesting perhaps a willingness and ability for property investors to hold a property vacant through the period of greatest disruption, confident things will improve soon. The earlier than expected move to alert level one will have assisted this position.
Recent employment data, released by Stats NZ, showing a lift in filled jobs of 0.8% on April illustrates a bounce-back from the prior monthly drop of 1.7%, however we know the full impact of the recession on the labour market is yet to come.
So while the cushioning impact of Government and bank support appears to have so far been successful, with downward (improved) revisions to unemployment projections now common place, the focus of attention remains on the next few months, as home owners roll off adjusted loan payment plans and the wage subsidies end (just announced to be 1st September).

According to the NZ Bankers Association, a total of 66,870 customers (totalling $21.3bn) have reduced their loan payments since March 26 (the start of lock-down) with a further 55,406 customers (totalling $19.5bn) deferring all their loan payments. The initial 3 month period for these plans will have now ended for some owners, which could mean a tougher decision approaches as they assess their financial situation and whether they need to raise capital by selling assets.
So while the lift in market activity and subsequently data to analyse is providing more clarity on where the market stands, we remain cautious about what the rest of the year could bring for the property market, with many forks in the road to come.
Note: The QV HPI uses a rolling three month collection of sales data. This has always been the case and ensures a large sample of sales data is used to measure value change over time. This does mean the measure can be less reactive to recent market movements but offers a smooth trend over time. However, due to having agent and non-agent sales included, the index provides the most comprehensive measure of property value change over the longer term.


