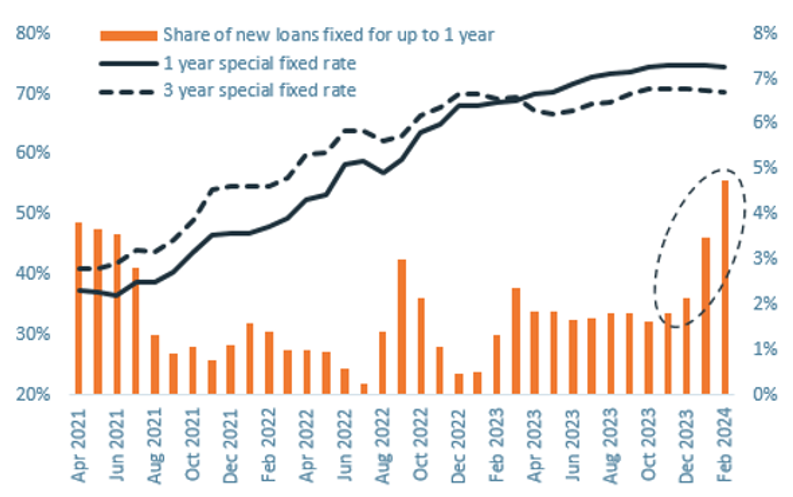
The proportion of short-term fixed mortgages has reached record levels, signalling that mortgage rates have peaked and that the medium-term outlook is downwards, CoreLogic NZ Chief Property Economist Kelvin Davidson says

The CoreLogic NZ April Housing Chart Pack shows that 56% of new loans by value taken out in February were fixed on one-year terms compared to 36% in December. On the flipside, the Reserve Bank figures, which cover loans for house purchase, bank switches, and top-ups, show the share of longer-term fixed rates has fallen.
The perfect borrowing strategy is only ever known in hindsight, but the trend to fix in the short-term reduces the risk of overpaying later, if and when mortgage rates drop. Of course, given that one-year fixed rates are currently higher than longer terms, it does mean paying more now.
The timing for meaningful mortgage rate falls is still very uncertain. Inflation remains a concern and the Reserve Bank doesn’t seem inclined to lower the official cash rate anytime soon. Other factors matter, such as offshore financing rates, but lower mortgage rates look more likely to occur in 2025 than 2024 at this stage.
Chart Pack data showed New Zealand’s residential real estate market is worth an estimated $1.63 trillion following a monthly increase in national average values of 0.5% in March.
The residential real estate market remained subdued during the first quarter of 2024 with a moderate rise of 1.1% in average property values across NZ for the period.
Property values in areas such as Wellington and Dunedin have slightly outperformed over the first three months of 2024, but Hamilton and Tauranga have been weaker increasing 0.1% and 0.5% respectively.
The price patchiness is also evident around the provincial areas and when you split the market by value band.
Stretched affordability and high mortgage rates are key challenges for the market. Increased stock levels are also giving buyers more choice and placing downwards pressure on prices, with an increase in new listings each week outweighing still-muted sales activity.
March sales volumes measured across both private deals and real estate agents increased for the 11th consecutive month, up about 9% higher than the same month last year to around 6,970.
While sales activity has risen to more than 70,000 on a 12-month total basis, transaction activity remains well below the long-term average of 90-95,000 sales per year.
New Zealand’s persistently strong net migration remained a key contributor for the historically high growth in rents, which were up by 5.1% in the year to March.
Even with the continued upward pressure on rents, last month’s increase was slightly slower than in recent months, possibly signalling that the upswing is about to lose steam.
This trend could also signal that potential home buyers are reaching their affordability limits, as increasing rents add pressure to already strained household budgets.
The country’s property recovery is best described as underwhelming and I would expect these muted conditions to continue throughout the year, particularly given mortgage rates remain high.
Many borrowers will also be repricing existing mortgages from their previous, lower fixed rates and the number of listings has also risen, which is providing buyers with more choice. These are all key factors to keep an eye on.
April Housing Chart Pack highlights:
- New Zealand’s residential real estate market is worth a combined $1.63 trillion.
- There was a 1.1% increase in average property values across NZ in the three months to March. Average values increased 0.1% in the year to March, the first positive figure since September 2022 (2.8%).
- Wellington and Dunedin were the strongest performing main centres increasing 1.6% in the first quarter, while Rodney and Franklin within Auckland were also solid, increasing 2.3% and 1.9% respectively in the three months to March.
- March sales volumes increased for the 11th consecutive month and were 9% higher than the same month in 2023.
- There were more than 70,000 sales in the year to March, still well below NZ’s 10-year average of more than 90,000 per year.
- There were 8,693 new listings over the four weeks ending 31st March
- Total stock on the market is 23% higher than the five-year average.
- National rental growth of 5.1% in the year to March is running at historically high levels.
- Gross rental yields nationally remain at 3.2% (from a trough of 2.6% for much of 2022), the highest level since late 2020.
- Around 59% of NZ’s existing mortgages by value are currently fixed but are due to reprice onto a new (generally higher) mortgage rate over the next 12 months.
- Inflation seems to have passed its peak and the Reserve Bank will wait to see the effects of the final 5.5% OCR for this tightening cycle.
Download and subscribe to the monthly CoreLogic Housing Chart Pack at corelogic.co.nz/news-research/reports/housing-chart-pack.


